Data Handling
Highcharts Dashboards uses a dedicated set of elements for effective data management. The data handling system is designed to provide a flexible and powerful way to load, modify, and display data through the dashboard components.
The following diagram illustrates the entire data management:
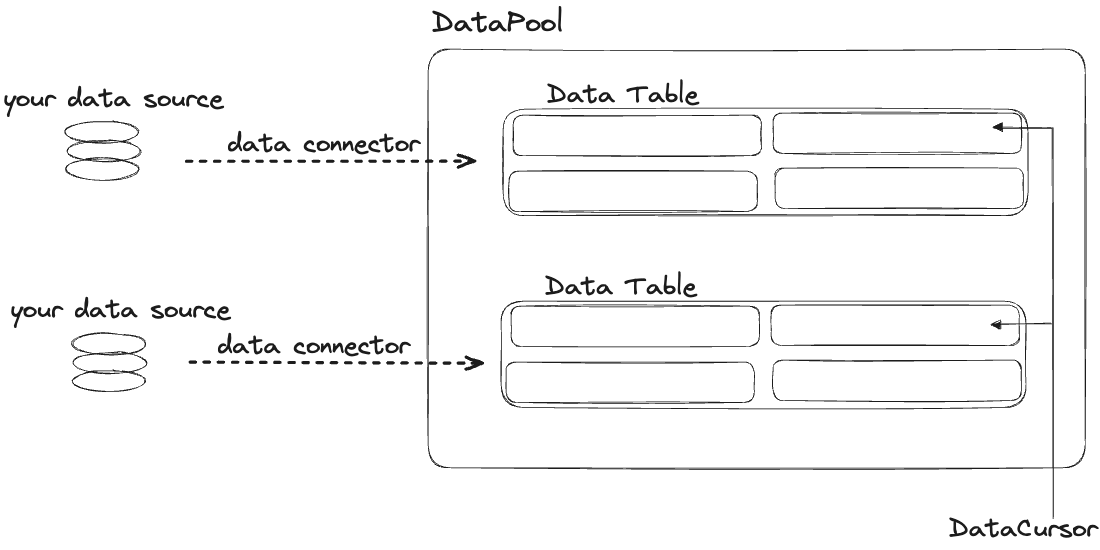
DataPool
The DataPool is the main entry point for data handling in Highcharts Dashboards.
It can be linked to a warehouse where various products are stored. It handles incoming data from various sources and provides a way to access and
modify it. However, it also provides a way to use that data in the dashboard’s components and synchronize the data between them.
With the BoardOptions.dataPool option, you can define as many connections to
data sources as you like. Each definition is accessible by its id and will
only create a connector to load the actual data when accessed the first time
via Board.dataPool.getConnector.
DataConnector
The DataConnector serves as a delivery service that brings data from external suppliers to the DataPool.
It retrieves data from external sources and creates new DataTables within the DataPool to store this imported data, similar to how the
delivery service brings new products to the warehouse for storage.
Each DataConnector loads data from a source and sometimes also saves data
changes. All connectors manage the data in a DataTable, which is accessible via
DataConnector.table property. Some connectors support source polling to update
the DataTable with new data from the source.
Dashboards provides several types of DataConnector, depending on the data source.
| Name | connector.type option |
|---|---|
| CSVConnector | 'CSV' |
| JSONConnector | 'JSON' |
| GoogleSheetsConnector | 'GoogleSheets' |
| HTMLTableConnector | 'HTMLTable' |
Each of those types has its specific options. For example, the CSVConnector
has two data input options. Directly as a string - options.csv, or as a URL from which the CSV file is fetched - options.csvURL.
Examples
dataPool: {
    connectors: [{
        id: 'my-csv-connector',
        type: 'CSV',
        options: {
            csvURL: 'https://demo-live-data.highcharts.com/updating-set.csv'
        }
    }]
}dataPool: {
connectors: [{
id: 'my-json-connector',
type: 'JSON',
options: {
dataUrl: 'https://demo-live-data.highcharts.com/instance-details.json',
}
}]
}dataPool: {
connectors: [{
id: 'my-google-sheets-connector',
type: 'GoogleSheets',
options: {
googleAPIKey: 'AIzaSyCQ0Jh8OFRShXam8adBbBcctlbeeA-qJOk',
googleSpreadsheetKey: '1U17c4GljMWpgk1bcTvUzIuWT8vdOnlCBHTm5S8Jh8tw'
}
}]
}dataPool: {
connectors: [{
id: 'my-html-table-connector',
type: 'HTMLTable',
options: {
table: 'table-element-id',
}
}]
}DataTable
The DataTable is a storage system for the data in the DataPool.
Each DataTable within the DataPool is like a section or aisle within the warehouse dedicated to a particular type of product
where everything is organized and stored.
A DataTable is created from DataConnectors, DataModifiers, or other
DataTables. Each table can contain columns and rows. In
addition, DataTable also emits events when changes in the table happen. Changes
can be made directly on the table or with a DataModifier object.
DataModifier
The DataModifier is a tool to modify the data in the DataTables.
When a DataModifier is applied to a DataTable, it’s like assigning a specific team of workers to handle modifications for that batch of products.
They can change the products as needed and store the modified versions separately.
Data tables can automatically modify data during their lifetime with
the help of modifiers. Each table can have only one modifier, but this modifier
might call additional modifiers. If a DataModifier changes the DataTable,
changes are available on a clone in the DataTable.modified property.
DataCursor
The DataCursor provides a system to synchronize status data on cells of DataTables.
The DataCursor acts like a team of warehouse inspectors responsible for keeping track of the status of various products in different sections.
This can be, for example, highlights, markers, or selections. It
supports multiple tables and statuses simultaneously. Each dashboard has a DataCursor
accessible via the Board.dataCursor property.