Line chart
The line chart is represented by a series of datapoints connected with a straight line. Line charts are most often used to visualize data that changes over time.
Line chart features
The line chart inherit the options a series has plus some more. See the API reference for a full list of the line chart plotOptions.
Most options set in plotOptions can also be set on a individual series.
Step
Allows the use of steps instead of a straight line.
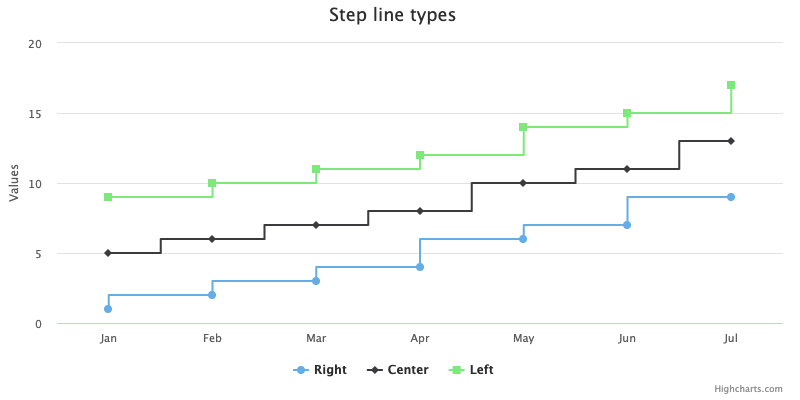
Code to enable step:
plotOptions: {
    series: {
        step: 'left' // or 'center' or 'right'
    }
}